A little historical perspective and a good article on home ownership.
This is American data but Canada would be similar.
What is the Historical Rate of Return on Housing?
Posted January 18, 2024 by Ben Carlson
A reader asks:
Ben, I love reading your work. Stocks, bonds, and cash are the categories to compare but it hit me as a boomer retired, what about home ownership as a comparison? Stay warm!
This question was in response to my recent piece on the historical returns for stocks, bonds and cash:
There are typically a fair number of requests for other asset classes whenever I post this kind of data.
As luck would have it, my favorite resource for historical asset class returns recently added housing (and gold) to the mix. These are the annual returns from 1928-2023 for stocks, bonds, cash, housing and gold along with the annual inflation number:
Stocks +9.8%
Bonds +4.6%
Cash +3.3%
Real Estate +4.2%
Gold +4.9%
Inflation +3.0%
Now here they are broken down even further by decade:
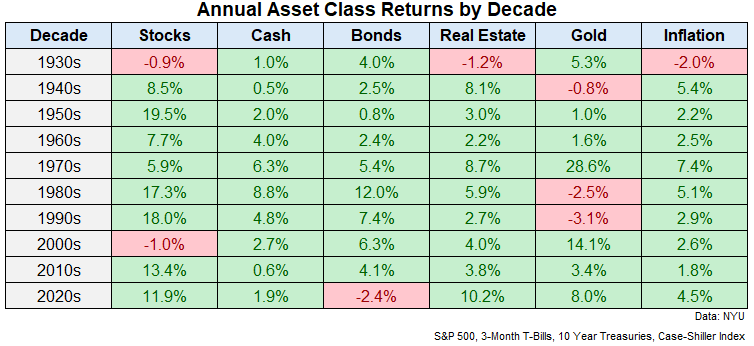
The 2020s have been an aberration for housing returns. Housing prices are already up nearly 50% in total just four years into the 2020s. Thats already better than the total returns for the entire decades of the 1990s, 2000s and 2010s.1
The historical returns for stocks have crushed real estate returns while bonds and gold have done slightly better than owning a home.
So does this mean housing is a lousy investment?
Not necessarily.
The Case-Shiller Index does a good job of tracking housing prices on a national basis but that doesnt mean its a good proxy for returns on housing.
Calculating returns on stocks, bonds, cash, and gold is fairly straightforward. You have the beginning price, the ending price and any cash flows that were earned along the way.
None of these historical returns include fees or taxes but fees are so low these days with the advent of ETFs and index funds that frictions arent a huge deal anymore.
Housing is the most unique of all financial assets in a number of ways.
First of all, there is the leverage component. Sure, some people pay cash for their home but most people borrow money to make the biggest purchase of their life.
Lets say you put 20% down on a $450,000 house. Then it subsequently rises 25% in price so your house is now worth $562,500.
Gross of all costs whats your return?
Is it 25%? Or is it actually 125%?
The price went up $112,500 but your initial investment was only $90,000. Thats a return of 125% on your initial investment.
So maybe housing is an even better investment than most people think?
It depends.
Over the life of your loan you have to pay interest expenses, insurance, property taxes, maintenance and upkeep. Plus, many homeowners refinance their loans which costs money. People renovate (also expensive).
Bid-ask spreads for ETFs are infinitesimally small. Thats not the case in the housing market where frictions are enormous. When you buy a home there are moving costs, closing costs, inspections, title insurance and other fees the banks seemingly make up. Selling your house requires many of these same fees along with realtor costs.
Confused yet?
And even if you kept track of all these expenses in a spreadsheet to tally up your true cost of home ownership, there is the fact that you have to live somewhere. If you werent paying your mortgage you would be paying rent somewhere, which has an inflation component to it.
Does anyone really know how much more theyre spending (or maybe saving) by owning versus renting?
Add it all up and I dont think there is a single person in America who can confidently state what the return is on their home. Thats why I dont think there is a legitimate way to gauge the true historical return for housing like there is for the other asset classes.
The numbers from Robert Shiller are probably right directionally from a price perspective, but that says nothing of the actual return most homeowners receive.
Now, if youre buying and selling rental properties, its much easier to account for the ROI from a cost perspective in terms of the assets worth, how much youre bringing in every month in rent, and how much youre shelling out in costs.
But most people dont fully grasp what the return is on their home.
For some people, its probably much better than they think depending on timing and location. For others, its likely worse than they think.
And thats OK!
We shouldnt be comparing the roof over your head to an S&P 500 index fund. Vanguard doesnt provide you shelter when you buy an index fund. Its impossible to compute the psychic income you get from owning a home in the neighborhood and school district you desire.
If I had to guess the actual returns on housing in America are probably closer to the stock market than the bond market because of the leverage involved. Housing prices mostly go up and rarely fall. Even a small steady return when youre only putting 20% or less down can make for a wonderful return over the long haul.
But housing is far too circumstantial to put a number on it without making a ton of assumptions.
I like to think of my house as more of a home than a financial asset but it does provide a nice hedge against inflation and the ability to borrow against it if need be.
For most people, its a form of forced savings, which is even more important than the actual return.
Either way, I dont think it makes sense to compare your house to stocks, bonds, gold, crypto, or any other asset class.
Housing is the most emotional asset you can own.